 Rangeland Analysis Platform
Rangeland Analysis Platform 10-meter Dataset
The USDA Agricultural Research Service and partners are excited to announce a new 10-meter vegetation cover dataset (RAP 10-m) for the Rangeland Analysis Platform.
What is the Rangeland Analysis Platform?
The Rangeland Analysis Platform (RAP) was first launched in 2018. Developed in partnership by the USDA Natural Resources Conservation Service (NRCS), the Bureau of Land Management (BLM), and the University of Montana (UMT), the RAP is an online mapping application that combines satellite imagery with thousands of on-the-ground vegetation measurements collected by the National Park Service, the BLM, and the NRCS. The power of cloud computing and machine learning technology allows the RAP to easily map vegetation across the United States. The RAP is now managed by the USDA Agricultural Research Service’s Jornada Research Program.
What is new with this RAP update?
Since its launch in 2018, the RAP provided data for certain vegetation communities, or plant functional groups, including bare ground, annual forb and grass, perennial forb and grass, shrub, tree, and litter, from 1984 to present at a 30-meter resolution. The updated RAP-10 meter cover dataset enables users to examine rangeland processes at finer-scales (10 meters vs. 30 meters) from 2018 to present (Figure 1) and adds new plant functional groups in addition to those provided by RAP 30-m. The new indicators in RAP 10-m include invasive annual grass, sagebrush, and pinyon-juniper species, as well as canopy gap . In addition to the finer, 10-meter spatial resolution, the RAP 10-m cover dataset provides improved predictions of vegetation cover compared to the prior data (Table 1, Figure 2, Figure 3).
How is the RAP 10-m model different?
RAP 10-m cover data use satellite data from the Sentinel-2 missions. Compared to the Landsat satellite data used for RAP 30-m, Sentinel-2 satellites have a finer spatial resolution, increased temporal revisits (every five days with two satellites), and an increased number of spectral bands. These advancements reduce error and permit the prediction of additional plant functional groups.
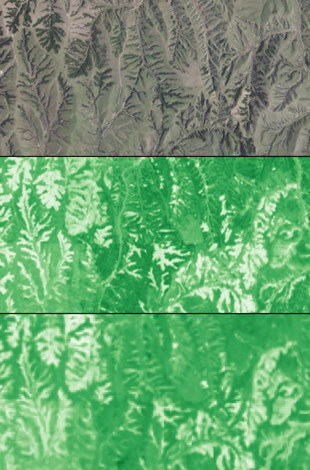 Figure 1. A comparison of NAIP imagery (1-m resolution; top panel), RAP 10-m perennial forb and grass cover (1-m resolution; middle panel), and RAP 30-m perennial forb and grass cover (30-m resolution; bottom panel). RAP 10-m provides greater detail and accuracy, enabling users to more confidently monitor their rangeland.
How do I access the new RAP 10-m data?
- Rangelands.app
- Google Earth Engine
- Google Earth Engine Community Catalog
- University of Montana FTP site
Can I keep using the RAP 30-m data?
Yes! The RAP v3 30-m cover data will continue to be available. The RAP 30-m cover data will be especially useful when pre-2018 historical context is needed.
When should I use the RAP 10-m data vs the RAP 30-m data?
The RAP 10-m cover data are well suited for landscapes with greater heterogeneity, when the new indicators are needed, when your analysis time frame is more recent, or when your question involves smaller, more discrete areas of interest (i.e., well-pads, small treatments). The RAP 30-m data may be better for mapping and analyzing long-term trends and anomalies. Management objectives and local knowledge can help you decide when to use one (or both) products. For more on how to use remotely sensed products, see: Allred et al. 2022.
What is the difference between the RAP cover dataset and the RAP production dataset?
The RAP cover dataset provides the percent cover of various vegetation, or plant functional groups, found in rangelands. The RAP production dataset provides analyses for how much biomass a particular plant functional group has produced over time in a specific area.
Will there be a 10-m RAP production dataset?
We hope so! Iteration and innovation are central to ensuring that RAP is useful for rangeland management in the years to come. RAP production will remain at 30-m for now, but we are currently exploring improvements and updates to the production data.
Who are the RAP partners?
USDA Agricultural Research Service, Bureau of Land Management, USDA Natural Resources Conservation Service, USDA Farm Services Agency, U.S Fish and Wildlife Service, University of Montana.
Figures and Tables
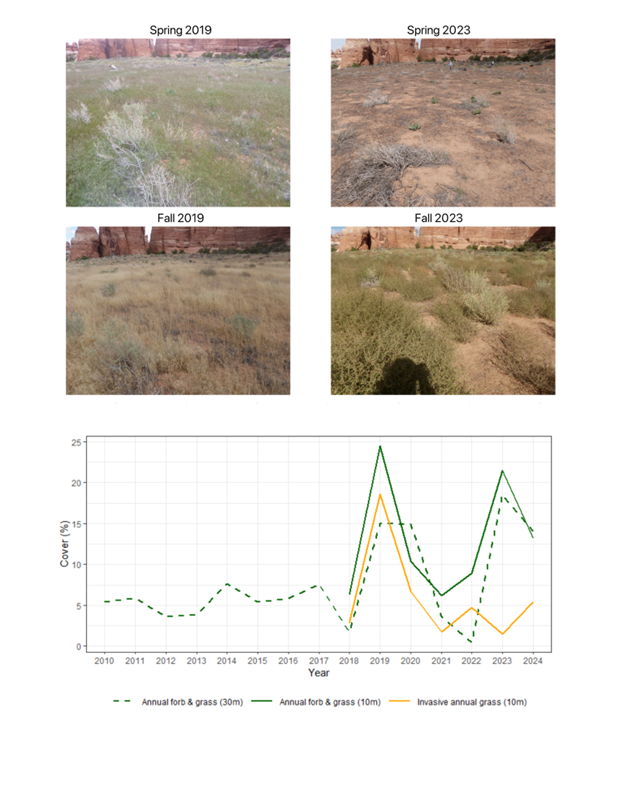 Figure 2. The increased temporal resolution of Sentinel-2 satellites allows the fractional cover model to distinguish between similar plant types with different phenological patterns. The four photographs were taken from the same location in Canyonlands National Park, UT, USA. Spring and fall 2019 photographs show high cover of Bromus tectorum, an invasive annual grass species that completes its life cycle during the spring and early summer. Spring and fall 2023 photographs show the same location in a year dominated by Salsola tragus, an introduced annual forb that reaches peak biomass in mid-to-late summer. The predicted cover for this location shows high cover of annual forb and grass in both of the years pictured, but correctly estimates high cover of invasive annual grass species only in 2019.
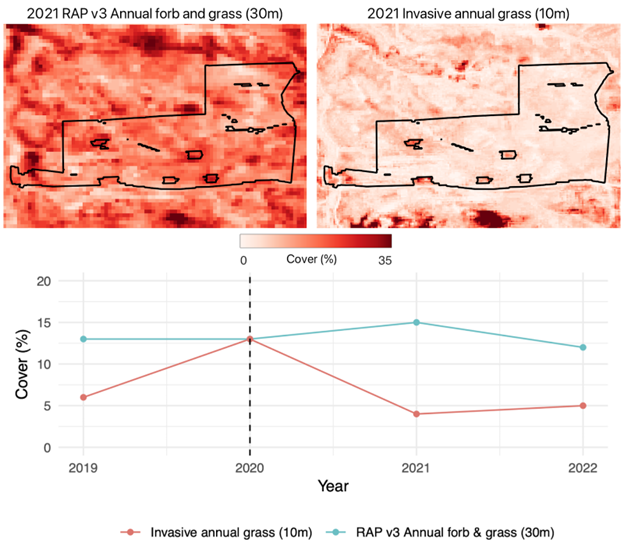 Figure 3. Comparing remotely sensed estimates of Landsat-based fractional cover for annual forb and grass (RAP v3, 30-m resolution)19 and RAP 10-m data for an herbicide treatment of invasive annual grasses. Visuals display estimated fractional cover one year post herbicide treatment. Time series represents the average across the treatment for each year; dashed line indicates the year of treatment. The 10-m, Sentinel-2 based estimate of fractional cover detects immediate reductions of invasive annual grasses and correctly highlights areas that were not treated (small inholdings within the treatment). Although cover values do not reach zero, the Sentinel-2 based estimate more closely reflects the near total eradication of invasive annual grasses post treatment (Mealor, personal communication, February 21, 2025). Treatment is near Sheridan, Wyoming, USA and is approximately 97 ha.
Table 1. RAP 10-m model performance metrics compared to RAP 30-m v3.0.
| RAP 10-m | RAP 30-m | |||
|---|---|---|---|---|
| Indicator | MAE (%) | RMSE (%) | MAE (%) | RMSE (%) |
| Annual forb and grass | 5.4 | 9.4 | 7.0 | 11.0 |
| Bare ground | 5.9 | 9.6 | 6.5 | 9.6 |
| Litter | 4.9 | 7.4 | 5.7 | 7.8 |
| Perennial forb and grass | 8.0 | 12.7 | 10.2 | 14.0 |
| Shrub | 5.0 | 7.8 | 6.2 | 8.8 |
| Tree | 2.3 | 6.3 | 2.6 | 6.7 |
| Sagebrush | 3.2 | 5.6 | - | - |
| Invasive annual grass | 3.4 | 7.1 | - | - |
| Pinyon-juniper | 1.3 | 4.1 | - | - |
| Gaps 25-50 cm | 2.6 | 3.9 | - | - |
| Gaps 51-100 cm | 3.3 | 4.9 | - | - |
| Gaps 101-200 cm | 3.7 | 5.8 | - | - |
| Gaps > 200 cm | 6.6 | 12.2 | - | - |