 Rangeland Analysis Platform
Great Basin Rangeland Fire Probability
Updated March 6, 2026
This page has been updated to include the most recent modeling efforts described in Smith et al. (2022).
What drives fire activity in the Great Basin?
Fire is constrained by fundamentally different limiting factors depending on where you fall along a productivity gradient. In productive flammability-limited systems—primarily forests—fuels are abundant and structurally continuous, so fire activity is controlled primarily by whether conditions are dry enough to ignite and carry fire. In fuel-limited systems—arid grasslands, shrublands, and deserts—fuel moisture during the fire season is rarely a bottleneck. For these systems, the dominant driver is antecedent moisture promoting fuel accumulation. Wetter-than-normal growing seasons increase fine-fuel biomass, which is then available to burn during the subsequent fire season. Fire-season weather primarily modulates when fires occur and their behavior. The Great Basin is a textbook example of a fuel-limited system.
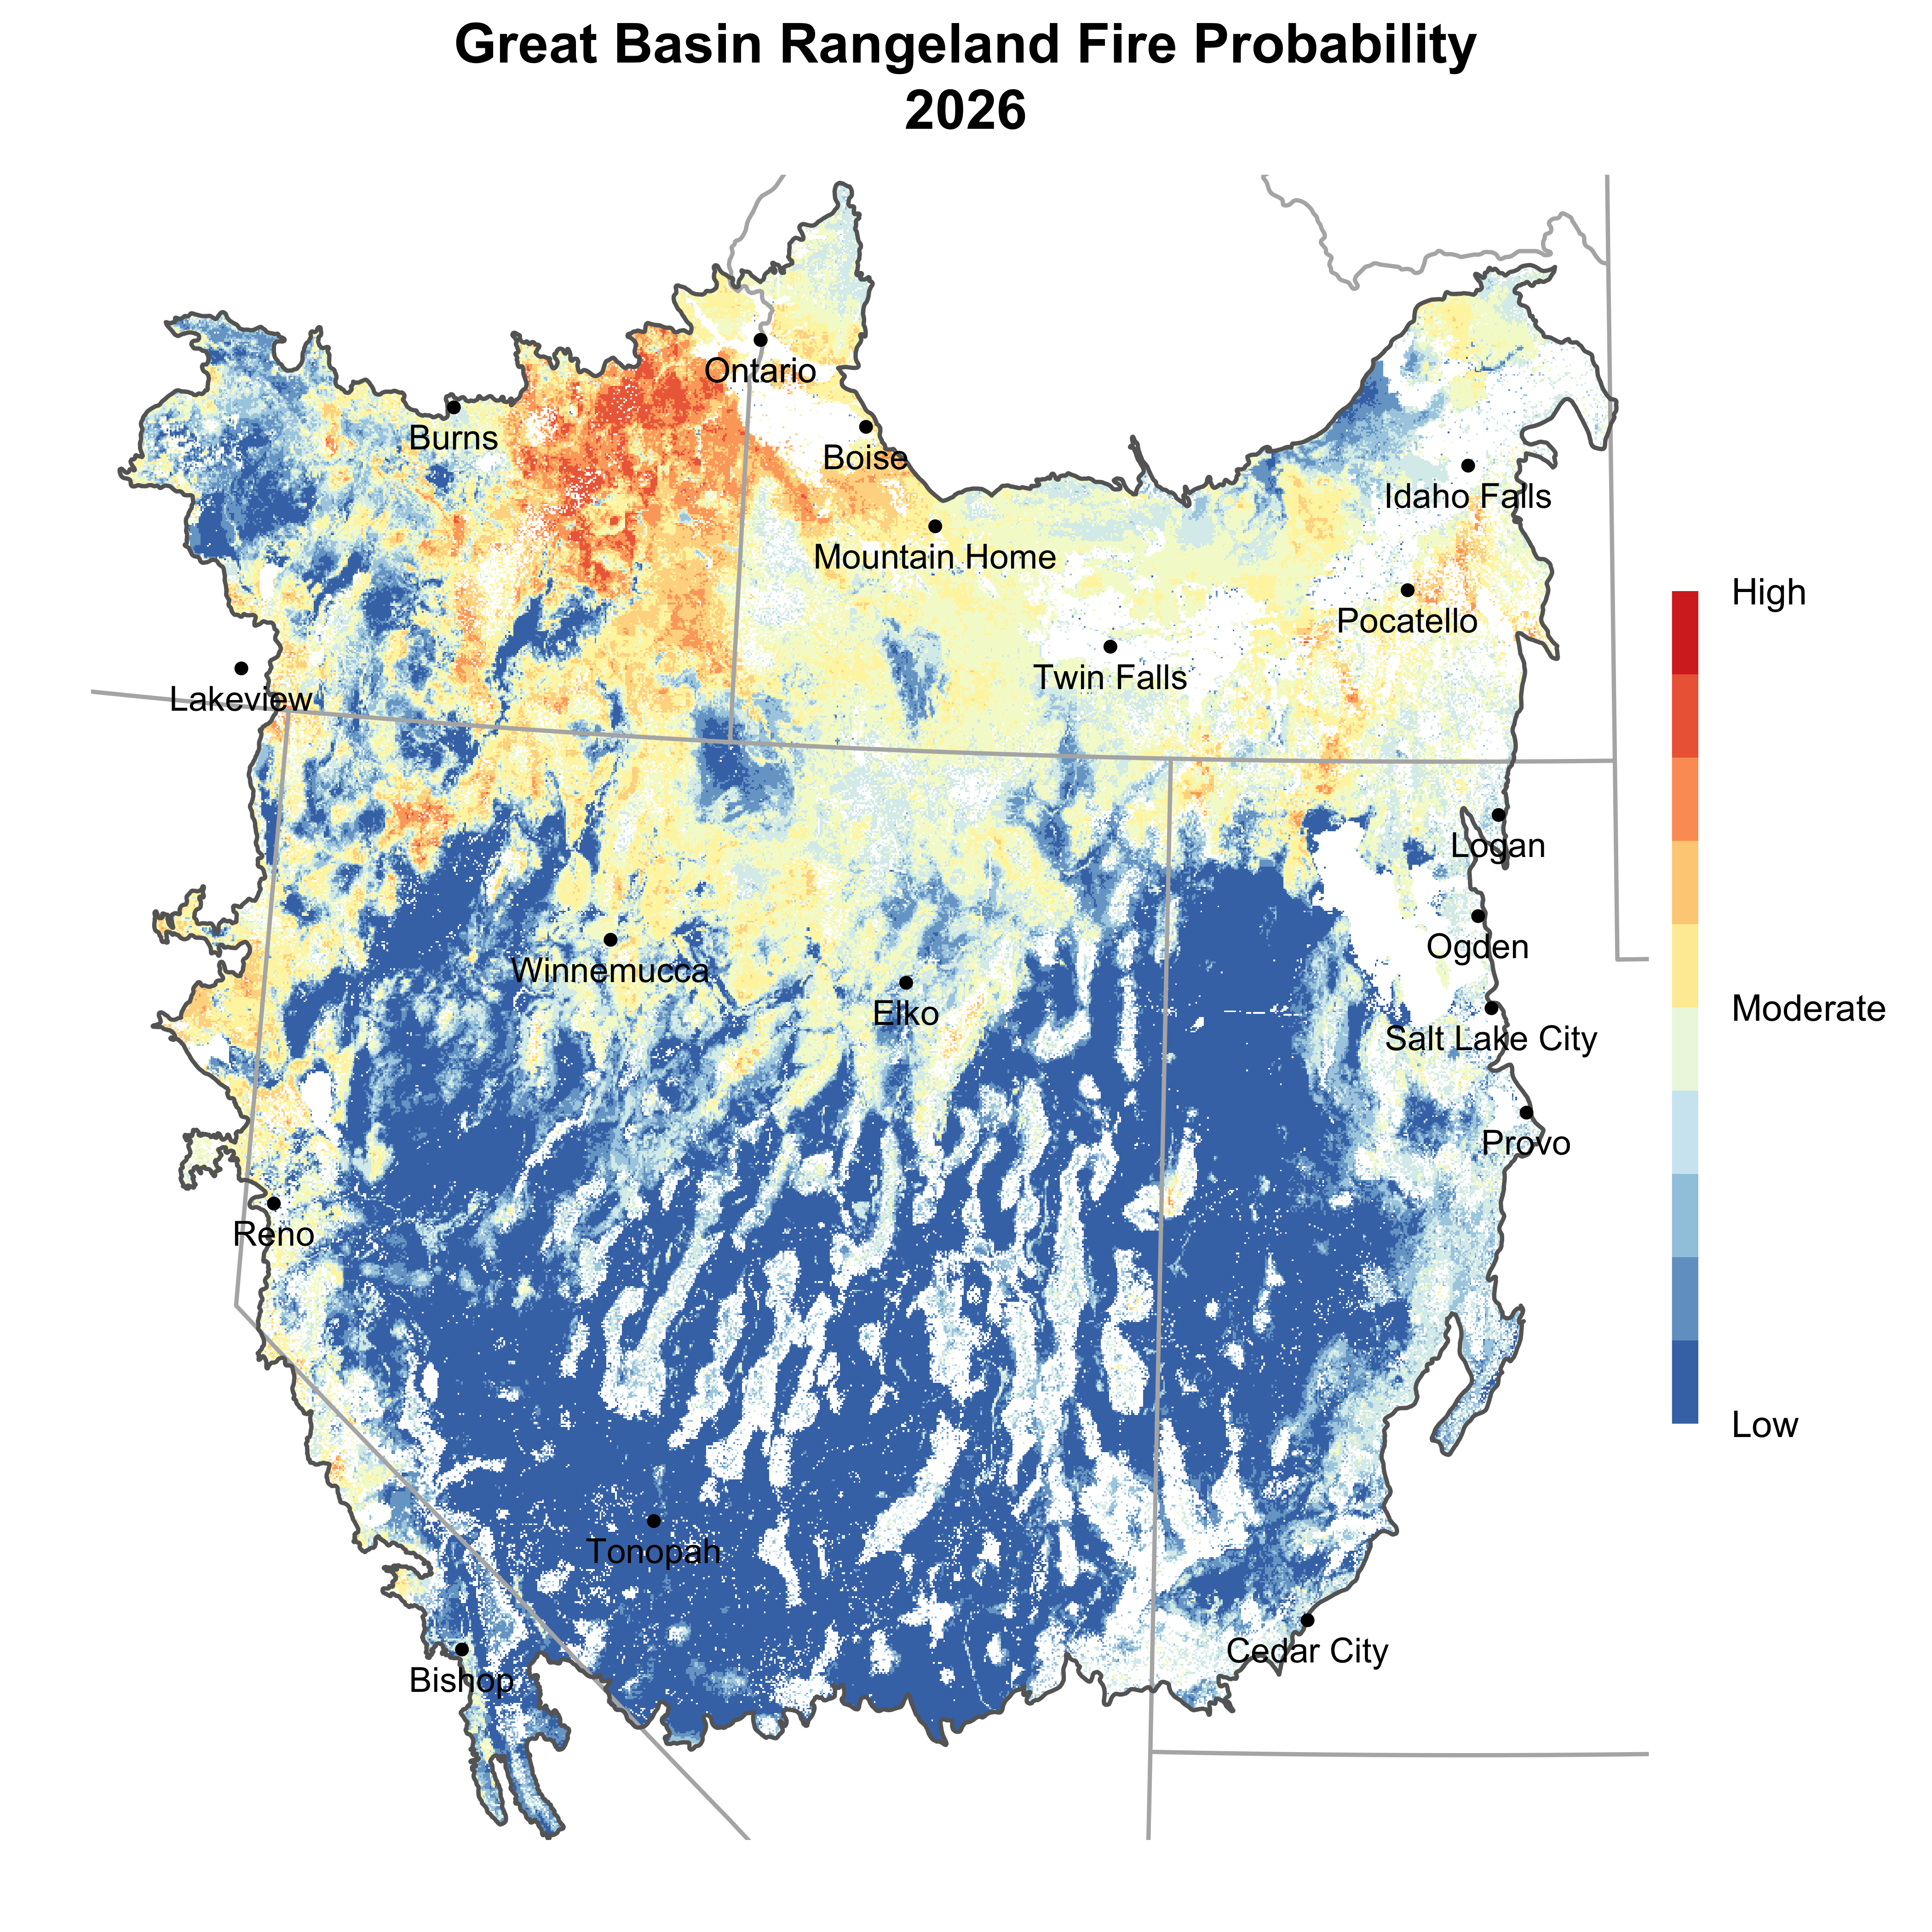
Where are large fires most likely to occur this year given an ignition?
This map represents the relative probability of a large (> 1,000 acres) rangeland fire, given an ignition, in the Great Basin. Probabilities are for the entire year or fire season. The map should be used alongside other fire risk or prediction services. Probabilities are calculated using RAP biomass and cover as well as several climate/drought indices. Maps are typically available in early March.
How does this year compare to the past?
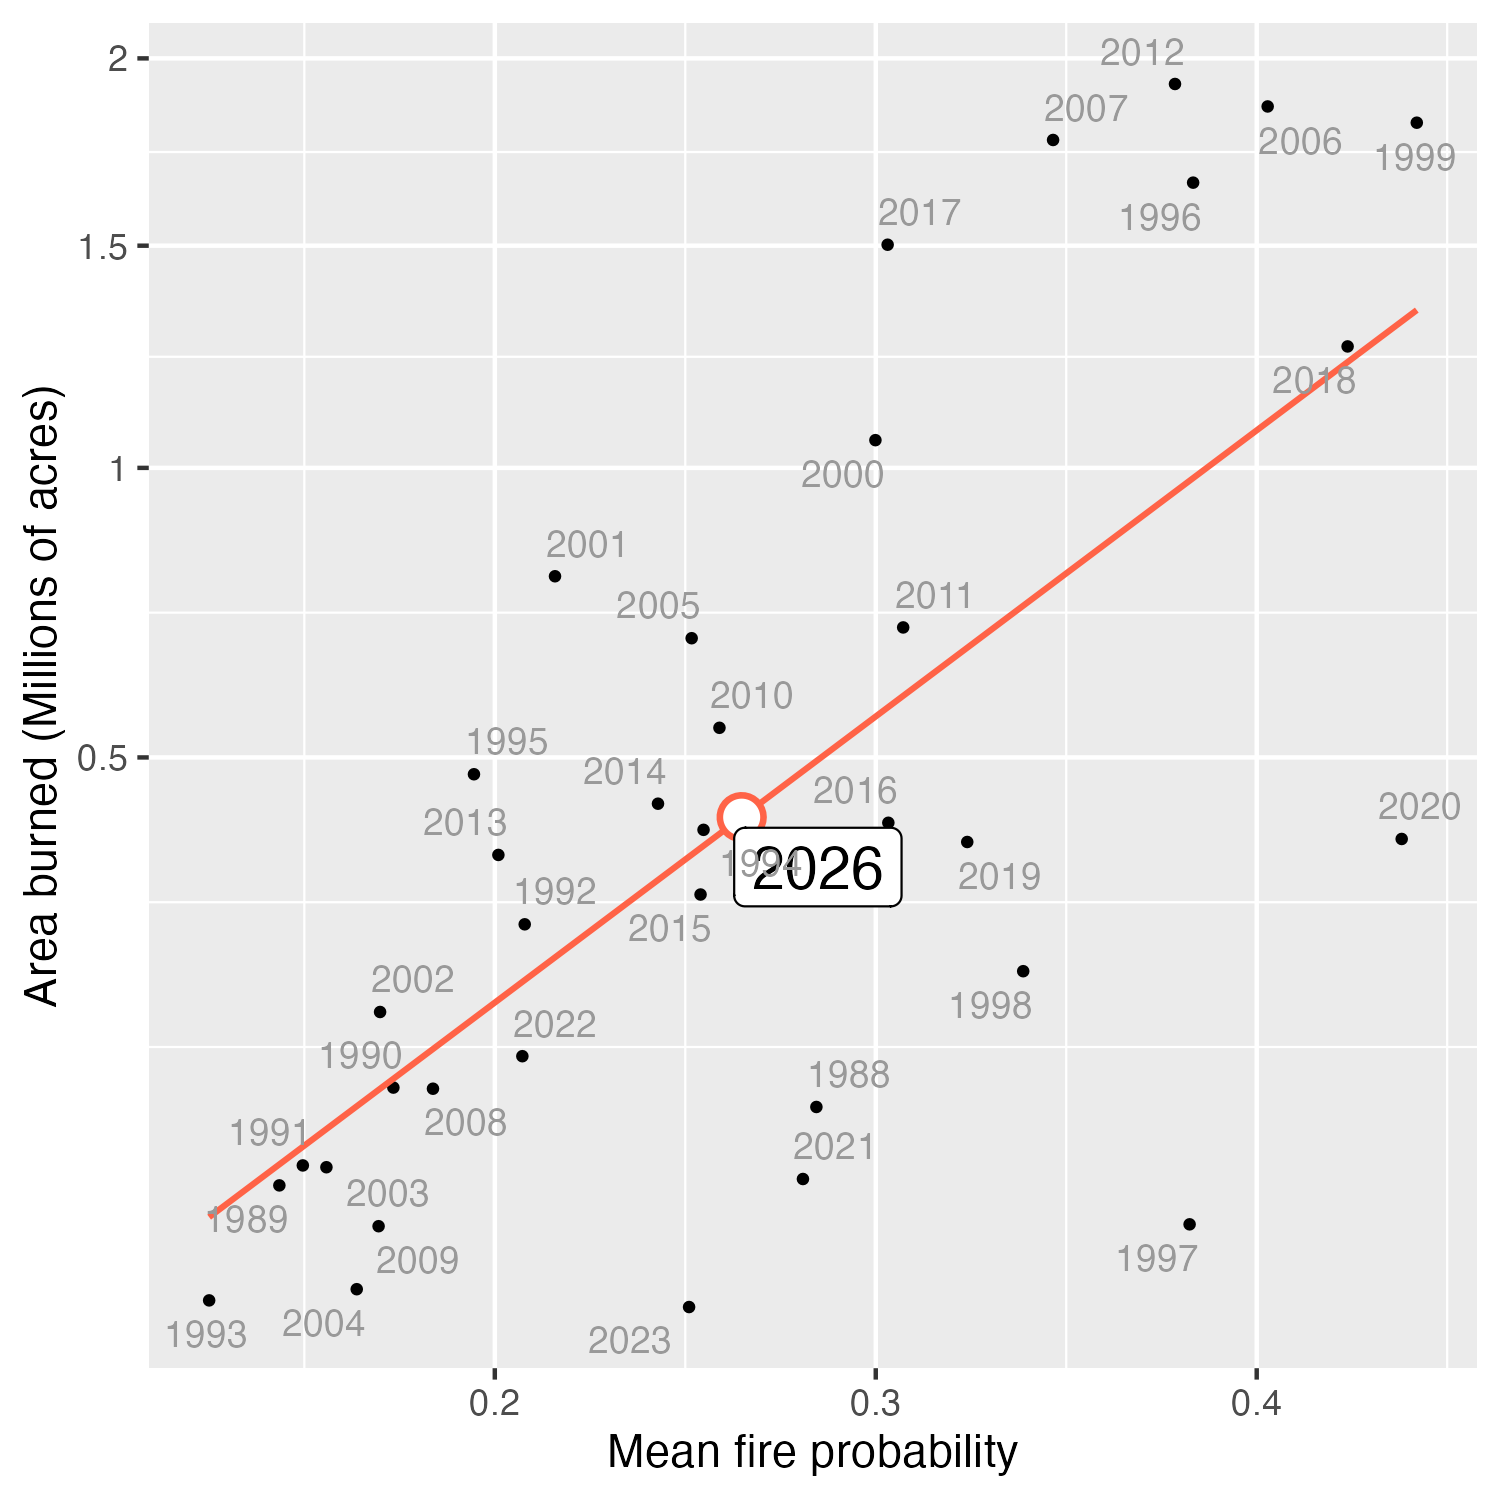
There is a clear relationship between the region-wide average fire probability across the Great Basin and the total area of rangelands burned that year (see figure below). 2026 is shown as a white dot along the regression line and represents a coarse prediction of the total area likely to burn in 2026. This allows us to compare how the coming fire season might relate to past years in terms of total area burned.
This prediction, however, entails considerable uncertainty. Besides fuels, the severity of the fire season depends on variables such as fire-season weather, ignitions, and fire suppression resource availability that cannot be predicted months in advance. For example, 2020 was predicted to have high fuel loading consistent with an above-average fire season, but very little fire activity occurred. Favorable antecedent conditions are necessary but not sufficient, which means that predicting when large fires will occur is harder than predicting when they won't.
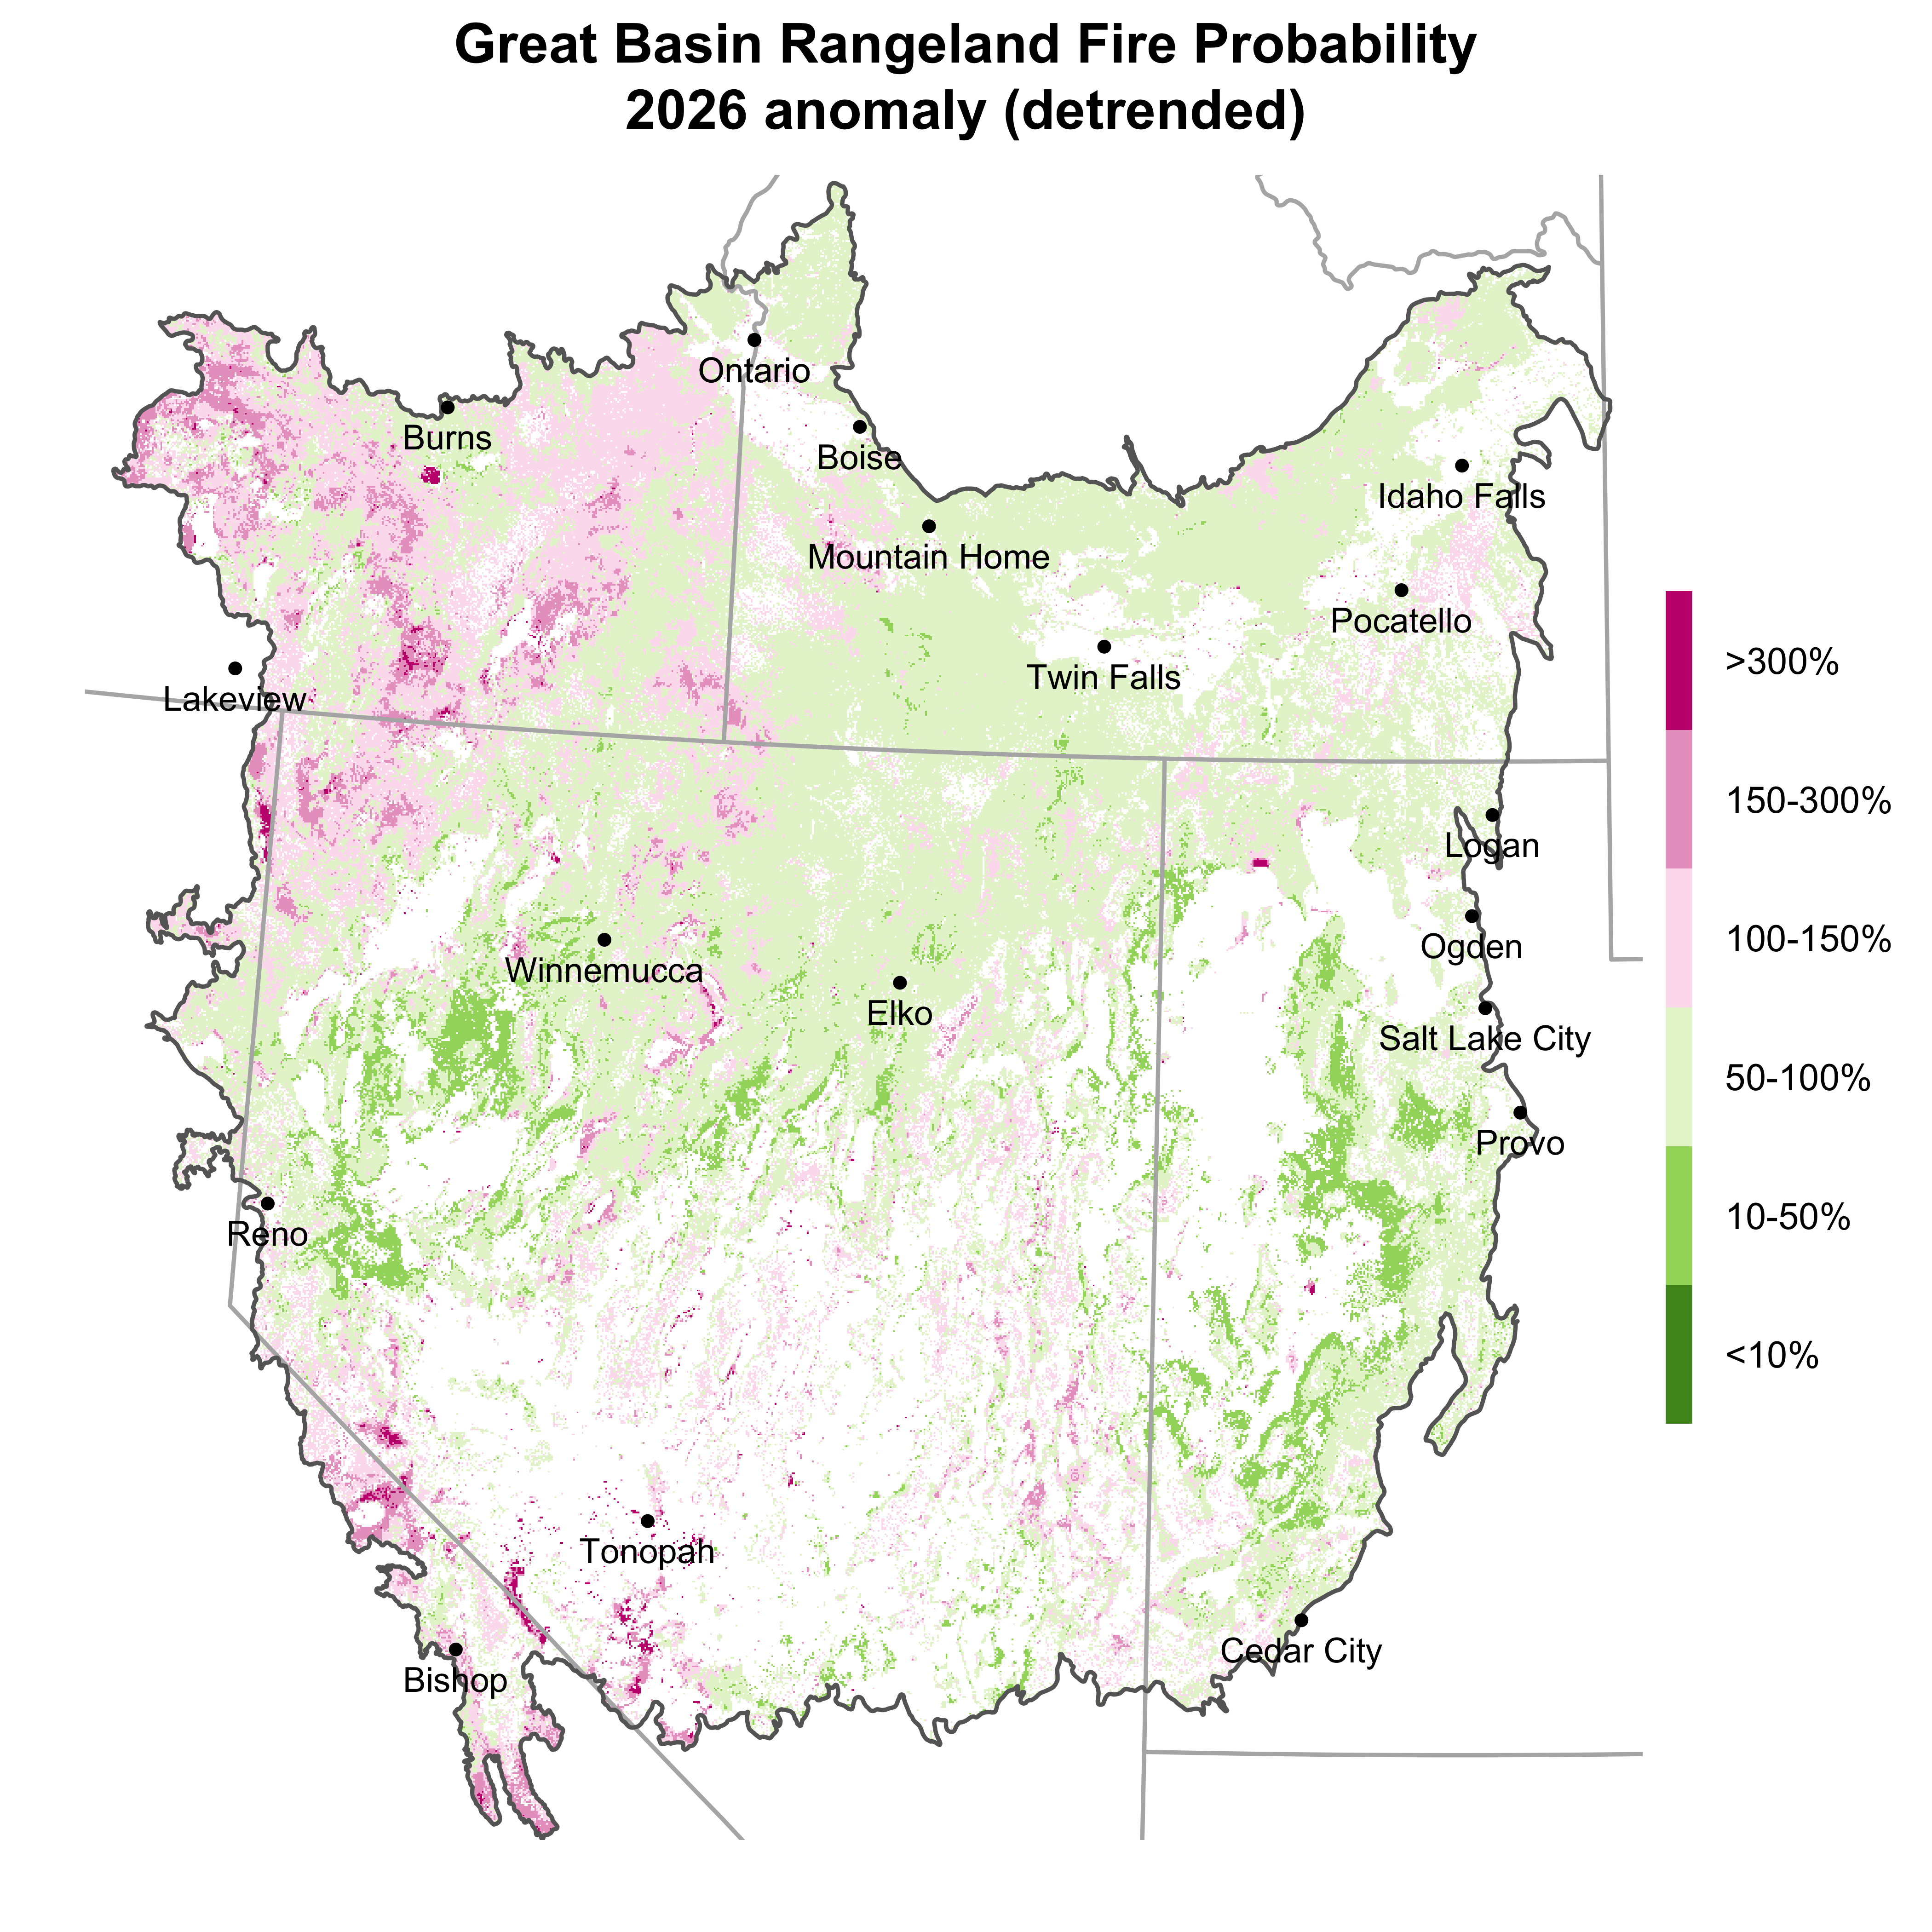
The following map shows this year’s probabilities relative to the recent past. Warmer colors indicate areas where fire probabilities are elevated relative to expectations, and cooler colors indicate where fire probabilities are relatively low this year. Areas where this year’s fire probability is negligible (i.e., <0.01) are not colored.
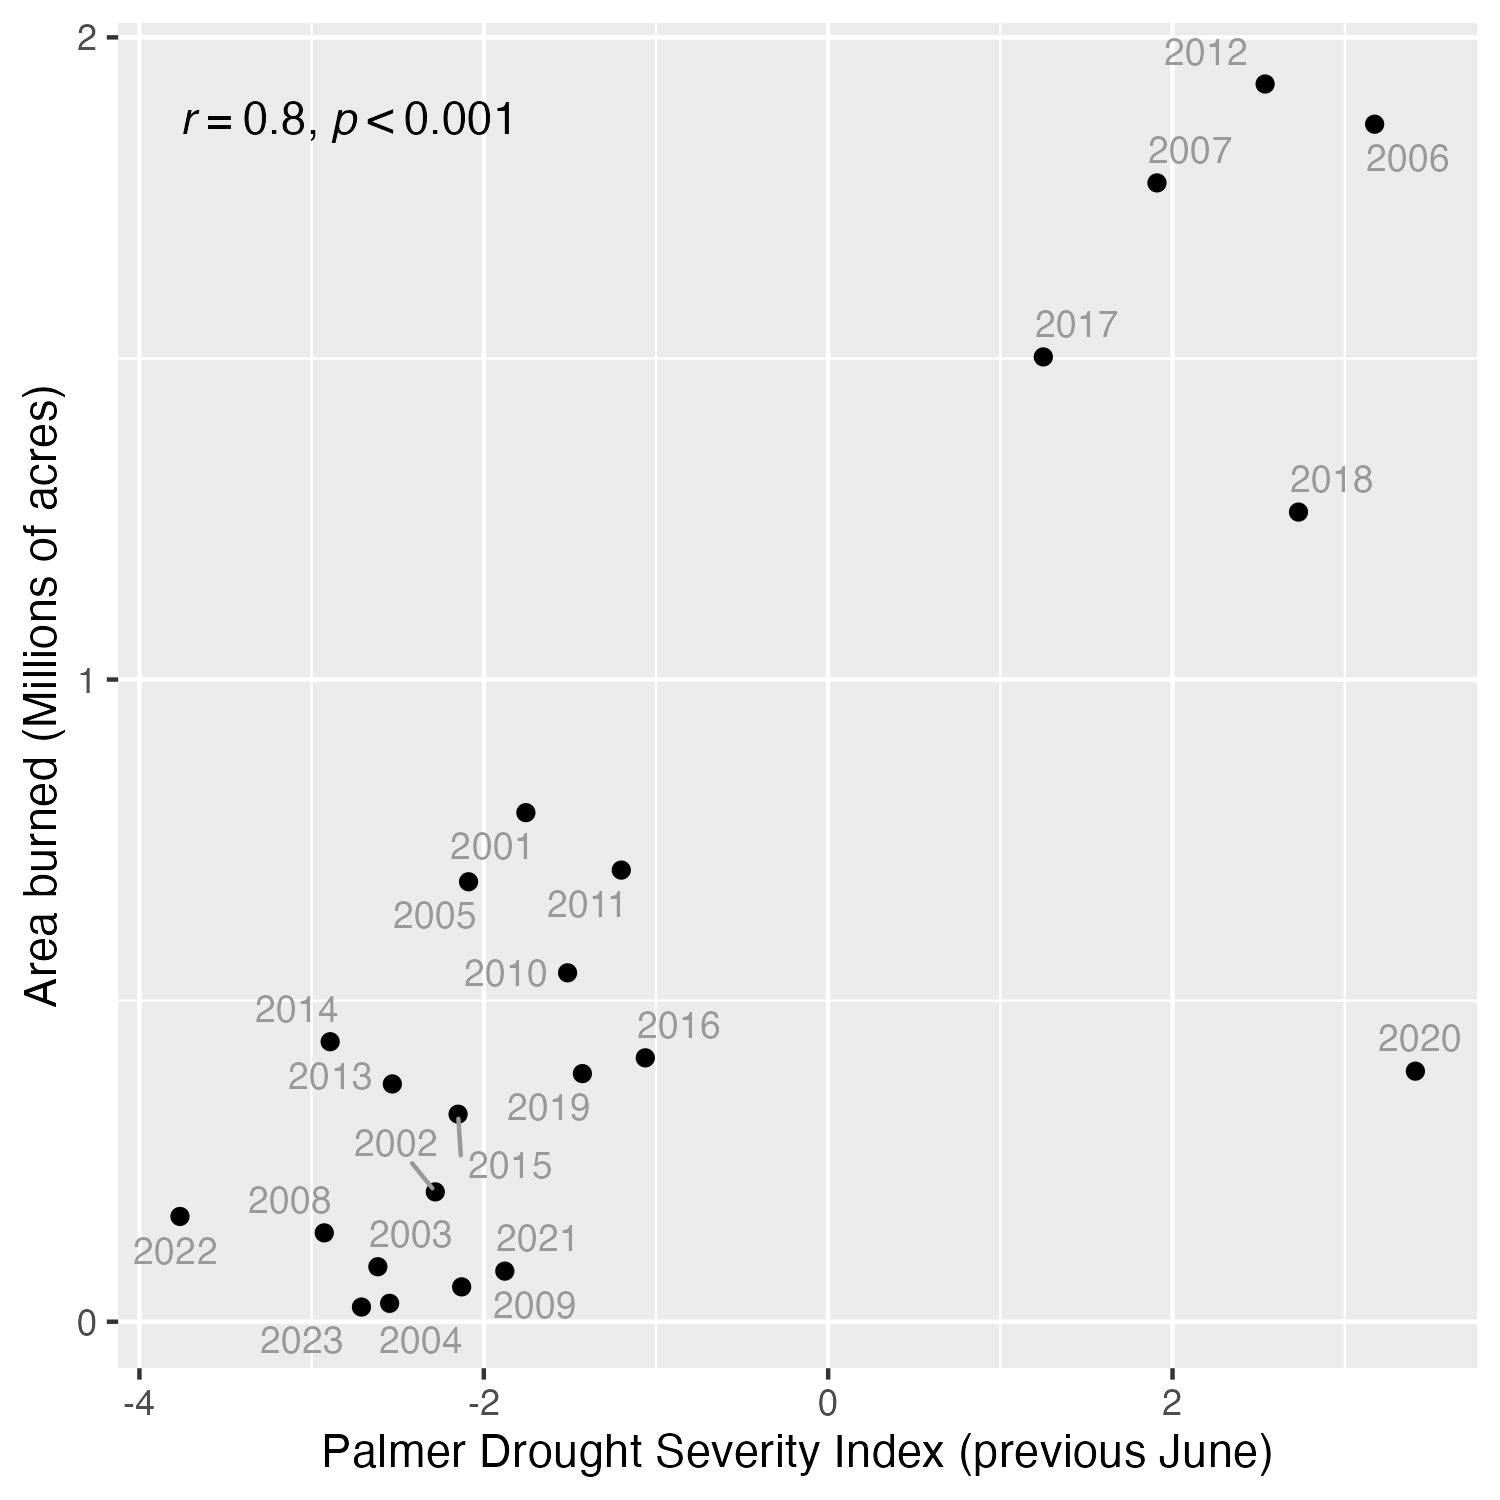
Across the Great Basin, there has historically been a strong correlation between the Palmer Drought Severity Index (PDSI) in June and the total area burned by wildfires the following year. This relationship, which corroborates the importance of the previous year’s vegetation production in controlling fire in the Great Basin, has been especially strong since about 2000. The PDSI from June of last year is therefore an additional indicator of the likely severity of the upcoming fire season. Last June's (2025) average PDSI across the Great Basin was roughly –1.7, indicating drier than average conditions prevailed and fuel accumulation was likely relatively low. Note the greater vertical spread among years on the right-hand side of the plot. High fuel loading implies the potential for a bad fire year, but this is not guaranteed. We can more confidently rule out a bad fire year than we can predict when one will occur.
Probabilities of past years and the fires that occurred (depicted by purple polygons) can be viewed in the video below.