 Rangeland Analysis Platform
Products
The Rangeland Analysis Platform (RAP) was first launched in 2018. Developed in partnership by the USDA Natural Resources Conservation Service (NRCS), the Bureau of Land Management (BLM), and the University of Montana (UMT), the RAP is an online mapping application that combines satellite imagery with thousands of on-the-ground vegetation measurements collected by the National Park Service, the BLM, and the NRCS. The power of cloud computing and machine learning technology allows the RAP to easily map vegetation across the United States.
RAP includes four data products
30-m Cover
The Rangeland Analysis Platform’s 30-m vegetation cover product provides annual percent cover estimates from 1986 to present of: annual forbs and grasses, perennial forbs and grasses, shrubs, trees, and bare ground. The estimates were produced by combining 75,000 field plots collected by BLM, NPS, and NRCS with the historical Landsat satellite record. Utilizing the power of cloud computing, cover estimates are predicted across the United States at 30m resolution, an area slightly larger than a baseball diamond.
Vegetation cover estimates are model predictions. When interpreting cover, it is important to consider the model error specific to each functional group. Error metrics measure the average difference between predicted model output and separate on-the-ground measurements. For vegetation cover, 10% (approximately 7,500 plots) of the field plot data were withheld from model training and used for evaluation. The error metrics in the table below represent the average accuracy of the model for each functional group:
| Indicator | MAE (%) | RMSE (%) |
|---|---|---|
| Annual forb and grass | 7.0 | 11.0 |
| Perennial forb and grass | 10.2 | 14.0 |
| Shrub | 6.2 | 8.8 |
| Tree | 2.6 | 6.7 |
| Bare ground | 6.5 | 9.6 |
These errors provide a general accuracy assessment. For example, across 7,500 field plots, the average RAP prediction for annual forb and grass pixel was +/- 7.0% (mean absolute error) relative to field plot measurements.
Citation
Allred, B.W., B.T. Bestelmeyer, C.S. Boyd, C. Brown, K.W. Davies, M.C. Duniway, L.M. Ellsworth, T.A. Erickson, S.D. Fuhlendorf, T.V. Griffiths, V. Jansen, M.O. Jones, J. Karl, A. Knight, J.D. Maestas, J.J. Maynard, S.E. McCord, D.E. Naugle, H.D. Starns, D. Twidwell, and D.R. Uden. 2021. Improving Landsat predictions of rangeland fractional cover with multitask learning and uncertainty. Methods in Ecology and Evolution. http://dx.doi.org/10.1111/2041-210x.13564
Data access
- Web map: https://rangelands.app/rap
- Google Earth Engine ImageCollection: ‘projects/rap-data-365417/assets/vegetation-cover-v3’
- Google Earth Engine Community Catalog https://gee-community-catalog.org/projects/rap/
- GeoTIFFS: http://rangeland.ntsg.umt.edu/data/rap/rap-vegetation-cover/
- GIS Tiles: https://rangelands.app/support/19-viewing-rap-data-in-your-gis
- Cloud Optimized GeoTIFFS (COGs) in GIS: https://rangelands.app/support/20-analyzing-rap-data-in-your-gis
- The rapr R package: https://humus.rocks/rapr/
10-m Cover
The RAP 10-m cover product is the newest addition to the RAP product suite. The RAP 10-m cover dataset enables users to examine rangeland processes at finer-scales (10 meters vs. 30 meters) from 2018 to present (Figure 1) across the western United States and adds new plant functional groups in addition to those provided by RAP 30-m. The new indicators in RAP 10-m include invasive annual grass, sagebrush, and pinyon-juniper species, as well as canopy gap. In addition to the finer, 10-meter spatial resolution, the RAP 10-m cover dataset provides improved predictions of vegetation cover compared to the prior data.
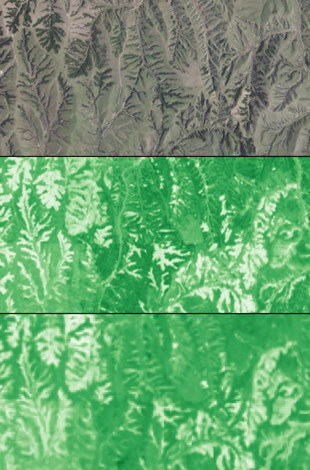 A comparison of NAIP imagery (1-m resolution; top panel), RAP 10-m perennial forb and grass cover (1-m resolution; middle panel), and RAP 30-m perennial forb and grass cover (30-m resolution; bottom panel). RAP 10-m provides greater detail and accuracy, enabling users to more confidently monitor their rangeland.
RAP 10-m cover data use satellite data from the European Space Agency Sentinel-2 missions. Compared to the Landsat satellite data used for RAP 30-m, Sentinel-2 satellites have a finer spatial resolution, increased temporal revisits (every five days with two satellites), and an increased number of spectral bands. These advancements reduce error and permit the prediction of additional plant functional groups.
RAP 10-m model performance metrics compared to RAP 30-m v3.0. For a description of the indicator calculation see Allred et al. 2025.
| RAP 10-m | RAP 30-m | |||
|---|---|---|---|---|
| Indicator | MAE (%) | RMSE (%) | MAE (%) | RMSE (%) |
| Annual forb and grass | 5.4 | 9.4 | 7.0 | 11.0 |
| Bare ground | 5.9 | 9.6 | 6.5 | 9.6 |
| Litter | 4.9 | 7.4 | 5.7 | 7.8 |
| Perennial forb and grass | 8.0 | 12.7 | 10.2 | 14.0 |
| Shrub | 5.0 | 7.8 | 6.2 | 8.8 |
| Tree | 2.3 | 6.3 | 2.6 | 6.7 |
| Sagebrush | 3.2 | 5.6 | - | - |
| Invasive annual grass | 3.4 | 7.1 | - | - |
| Pinyon-juniper | 1.3 | 4.1 | - | - |
| Gaps 25-50 cm | 2.6 | 3.9 | - | - |
| Gaps 51-100 cm | 3.3 | 4.9 | - | - |
| Gaps 101-200 cm | 3.7 | 5.8 | - | - |
| Gaps > 200 cm | 6.6 | 12.2 | - | - |
Citation
Brady W. Allred, Sarah E. McCord, Timothy J. Assal, Brandon T. Bestelmeyer, Chad S. Boyd, Alexander C. Brooks, Samantha M. Cady, Michael C. Duniway, Samuel D. Fuhlendorf, Shane A. Green, Georgia R. Harrison, Eric R. Jensen, Emily J. Kachergis, Anna C. Knight, Chloe M. Mattilio, Brian A. Mealor, David E. Naugle, Dylan O’Leary, Peter J. Olsoy, Erika S. Peirce, Jason R. Reinhardt, Robert K. Shriver, Joseph T. Smith, Jason D. Tack, Ashley M. Tanner, Evan P. Tanner, Dirac Twidwell, Nicholas P. Webb & Scott L. Morford. Sentinel-2 based estimates of rangeland fractional cover and canopy gap class for the western United States. Scientific Data, Volume 12, Article number: 1889 (2025).
Data access
- Web map: https://rangelands.app/rap
- Google Earth Engine
- Plant functional types ImageCollection: 'projects/rap-data-365417/assets/vegetation-cover-10m'
- Invasive annual grass ImageCollection: 'projects/rap-data-365417/assets/invasive-annual-grass-cover-10m'
- Sagebrush (Artemisia spp.) ImageCollection: 'projects/rap-data-365417/assets/sagebrush-cover-10m'
- Pinyon juniper ImageCollection: 'projects/rap-data-365417/assets/pj-cover-10m'
- Canopy gap ImageCollection: 'projects/rap-data-365417/assets/gap-cover-10m'
- Google Earth Engine Community Catalog https://gee-community-catalog.org/projects/rap/
- GeoTIFFS: http://rangeland.ntsg.umt.edu/data/rangeland-s2/
- GIS Tiles: https://rangelands.app/support/19-viewing-rap-data-in-your-gis
- Cloud Optimized GeoTIFFS (COGs) in GIS: https://rangelands.app/support/20-analyzing-rap-data-in-your-gis
- The rapr R package: https://humus.rocks/rapr/
Production
The Rangeland Analysis Platform’s vegetation production product provides annual and 16-day aboveground production from 1986 to present of: annual forbs and grasses, perennial forbs and grasses, and herbaceous (combination of annual and perennial forbs and grasses). Estimates represent new production throughout the year or 16-day period and do not include production in previous years. Aboveground production was calculated by separating net primary production (paritioned by functional group) to aboveground and converting carbon to production (Jones et al. 2021, Robinson et al. 2019). Estimates are provided in United States customary units (lbs/acre) to facilitate use. Although these data were produced across a broad region, they are primarily intended for rangeland ecosystems. Production estimates may not be suitable in other ecosystems, e.g., forests., and are not to be used in agricultural lands, i.e., croplands.
16-day production estimates for the current year are provisional and will be recalculated at the end of the year. Significant land cover changes (e.g., woodland to grassland, shrubland to grassland) during the current year may or may not be reflected in the partitioning of production to functional groups. We urge users to critically inspect current year 16-day production estimates and interpret appropriately.
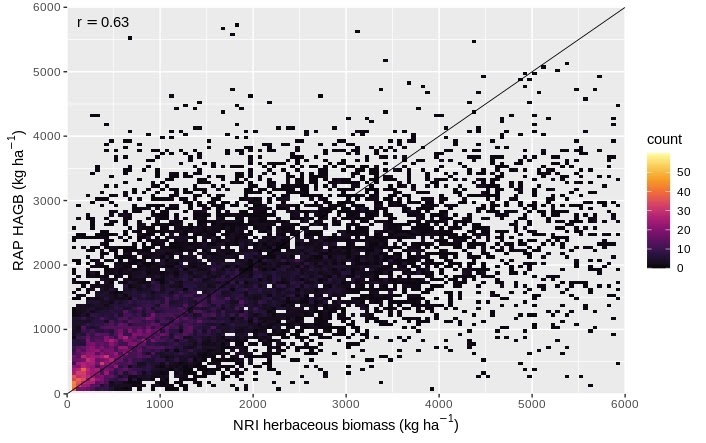
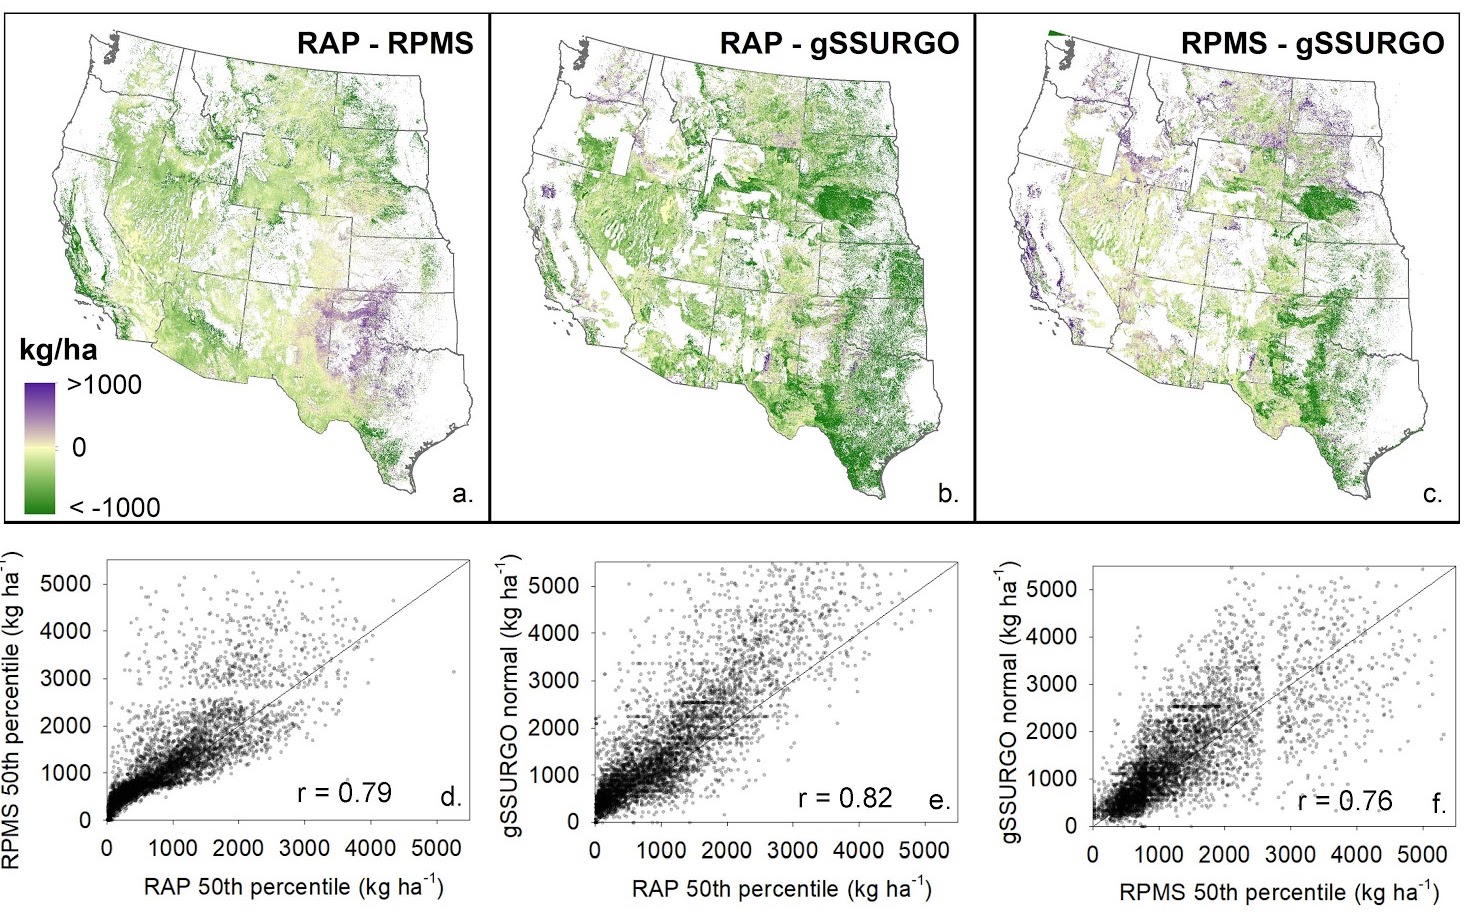
Production estimates are calculated using a process-based model and therefore traditional error metrics (e.g., MSE, RMSE) are not available. A comparison of production estimates to gSSURGO, the Rangeland Production Monitoring Service, and 16,591 USDA NRCS NRI on-the-ground estimates is reported in Jones et al. (2021).
Citation
Jones, M.O., N.P. Robinson, D.E. Naugle, J.D. Maestas, M.C. Reeves, R.W. Lankston, and B.W. Allred. 2021. Annual and 16-day rangeland production estimates for the western United States. Rangeland Ecology & Management 77:112–117. http://dx.doi.org/10.1016/j.rama.2021.04.003
Data access
- Web map: https://rangelands.app/rap
- Derived from Google Earth Engine Image Collections using a production conversion script (See example)
- 16-day production ImageCollection: ‘projects/rap-data-365417/assets/npp-partitioned-16day-v3’
- 16-day production provisional (current year) ImageCollection: ‘projects/rap-data-365417/assets/npp-partitioned-16day-v3-provisional’
- Annual production ImageCollection: ‘projects/rap-data-365417/assets/npp-partitioned-v3’
- Google Earth Engine Community Catalog https://gee-community-catalog.org/projects/rap/
- GeoTIFFS: http://rangeland.ntsg.umt.edu/data/rap/rap-vegetation-biomass/
- GIS Tiles: https://rangelands.app/support/19-viewing-rap-data-in-your-gis
- Cloud Optimized GeoTIFFS (COGs) in GIS: https://rangelands.app/support/20-analyzing-rap-data-in-your-gis
- The rapr R package: https://humus.rocks/rapr/
Partitioned NPP
The Rangeland Analysis Platform provides net primary productivity (NPP) estimates from 1986 to present. Estimates are partitioned into the following functional groups: annual forb and grass, perennial forb and grass, shrub, and tree. NPP is the net increase (i.e., photosynthesis minus respiration) in total plant carbon, including above and below ground.
Partitioned NPP cannot be viewed or analyzed in the RAP web application.
Citation
Robinson, N.P., M.O. Jones, A. Moreno, T.A. Erickson, D.E. Naugle, and B.W. Allred. 2019. Rangeland productivity partitioned to sub-pixel plant functional types. Remote Sensing 11:1427. https://dx.doi.org/10.3390/rs11121427
Data access
- Derived from Google Earth Engine Image Collections using a biomass conversion script (See example)
- 16-day NPP ImageCollection: ‘projects/rap-data-365417/assets/npp-partitioned-16day-v3’
- 16-day production provisional (current year) ImageCollection: ‘projects/rap-data-365417/assets/npp-partitioned-16day-v3-provisional’
- Annual production ImageCollection: ‘projects/rap-data-365417/assets/npp-partitioned-v3’
- Google Earth Engine Community Catalog https://gee-community-catalog.org/projects/rap/
- GeoTIFFS: http://rangeland.ntsg.umt.edu/data/rap/rap-vegetation-npp/
- GIS Tiles: https://rangelands.app/support/19-viewing-rap-data-in-your-gis
- Cloud Optimized GeoTIFFS (COGs) in GIS: https://rangelands.app/support/20-analyzing-rap-data-in-your-gis
- The rapr R package: https://humus.rocks/rapr/
Disclaimer
The Rangeland Analysis Platform is freely available for use by the public. The USDA Agricultural Research Service (ARS) and the U.S. Government have not placed any restriction on its use or reproduction of its contents. Although all reasonable efforts have been taken to ensure the accuracy and reliability of these data, the ARS and the U.S. Government do not and cannot warrant the performance or results that may be obtained by their use. The ARS and the U.S. Government disclaim all warranties, expressed or implied, including warranties of performance, merchantability or fitness for any particular purpose.