The Map Layers Panel
Mapping Vegetation Cover
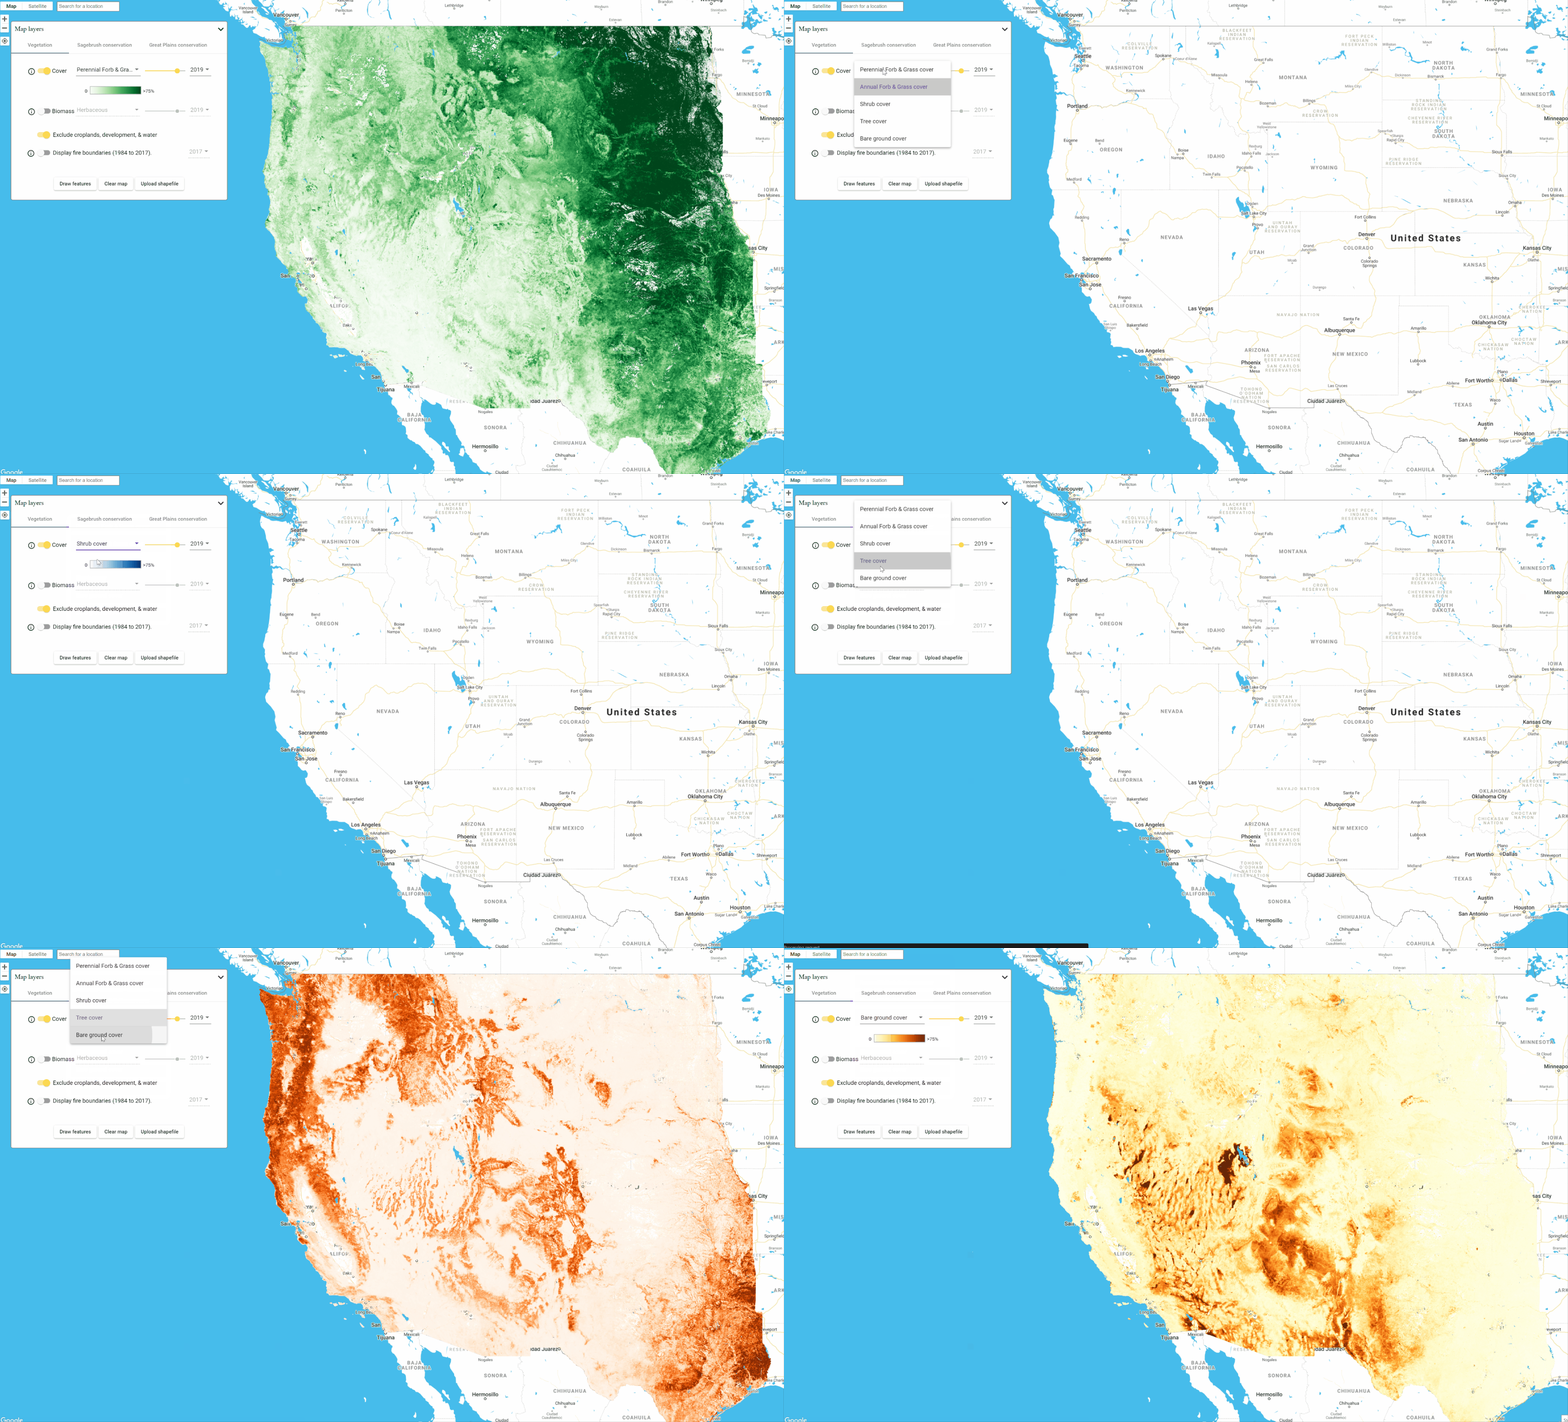
There are five plant functional types (PFTs) that are mapped by RAP:
- Perennial Forb & Grass cover
- Annual Forb & Grass cover
- Shrub cover
- Tree cover
- Bare ground cover
The vegetation cover dataset provides maps for every year between 1984 – present. Not only can RAP help to provide historical and spatial context for the rangeland landscapes that you work in, but it can help to quantify trends and trajectories.
Note:
You can learn more about the Vegetation Cover data in our explainer article.

Loess Canyons example
In exploring the historical vegetation cover data in RAP, we'll focus on an example of conifer expansion in a portion of southern Nebraska called the Loess Canyons.
The Loess Canyons region has experienced rapid expansion by Eastern Red Cedar conifer trees into grassland habitats, a trend that has occurred in other areas of the Great Plains leading to significant changes in herbaceous biomass production and habitat quality. As we proceed, remember that this is just one application of the vegetation cover dataset and that RAP was designed to be flexible to your data needs.
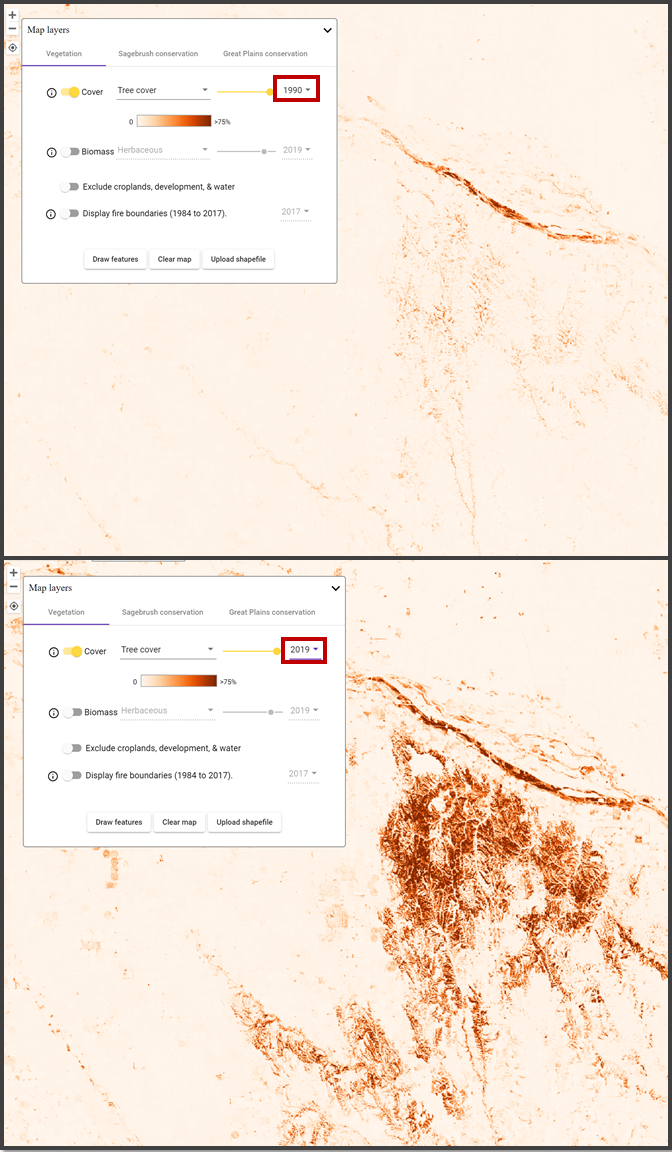
To evaluate tree cover in the Loess Canyons, we select the tree cover layer and use the "year" dropdown (highlighted in red in the maps below) to compare tree cover in 1990 to that of 2019. Immediately, we can see that tree cover is much more widespread today than it was 30 years ago. You are also encouraged to explore the incremental change that has occurred between those two years using the year dropdown menu.

Mapping Aboveground Biomass
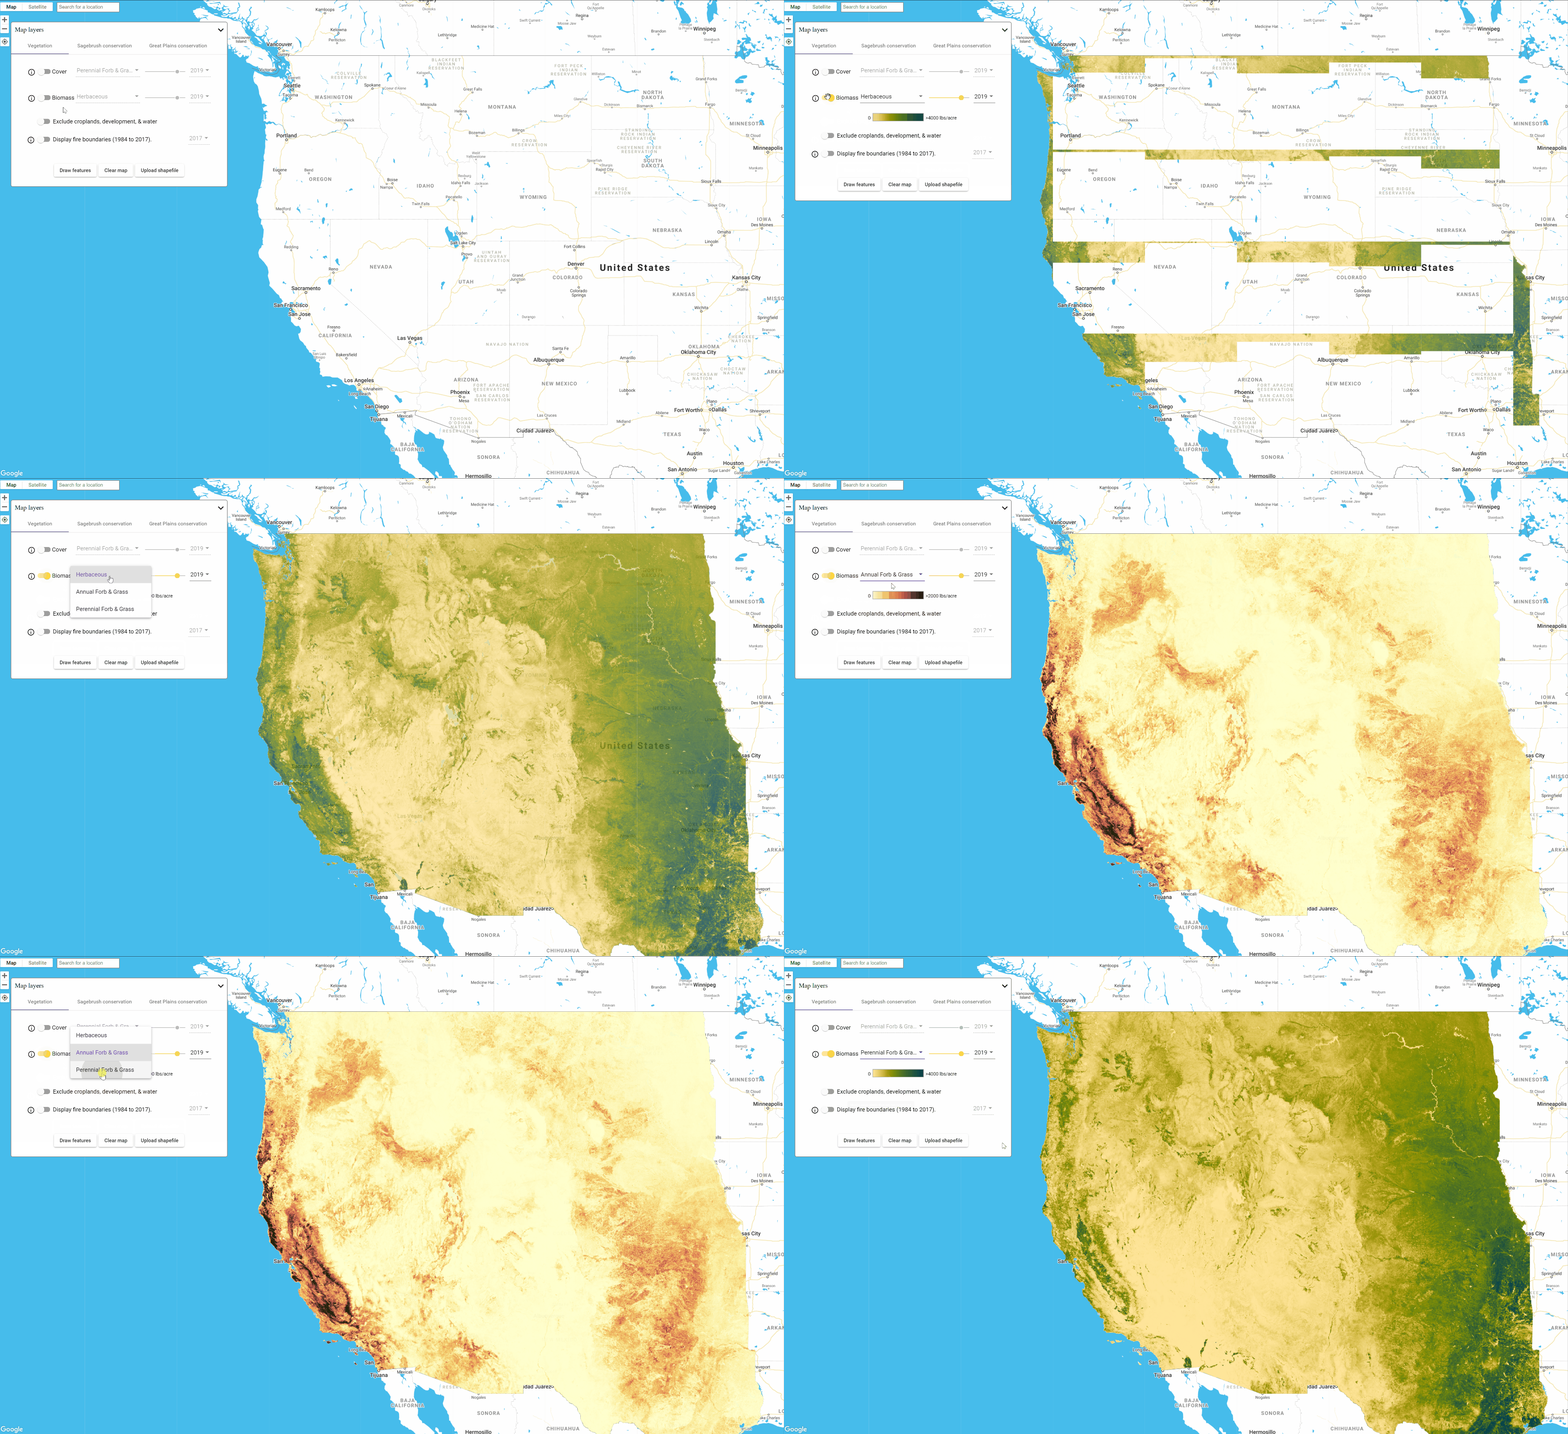
Mapping annual aboveground biomass follows essentially the same procedure as mapping vegetation cover described in the previous section. To toggle to Biomass mapping, click the switch next to Biomass in the Map Layers Panel. Then you will have three data layers available to you:
- Herbaceous (the sum of Annual Forb & Grass and Perennial Forb & Grass)
- Annual Forb & Grass
- Perennial Forb & Grass
Note:
You can learn more about the Herbaceous Biomass data in our explainer article.

Hot Pot Fire example
Biomass maps have many potential applications. In this tutorial, we will explore 2016's Hot Pot fire, which burned over 120,000 acres in Northern Nevada.
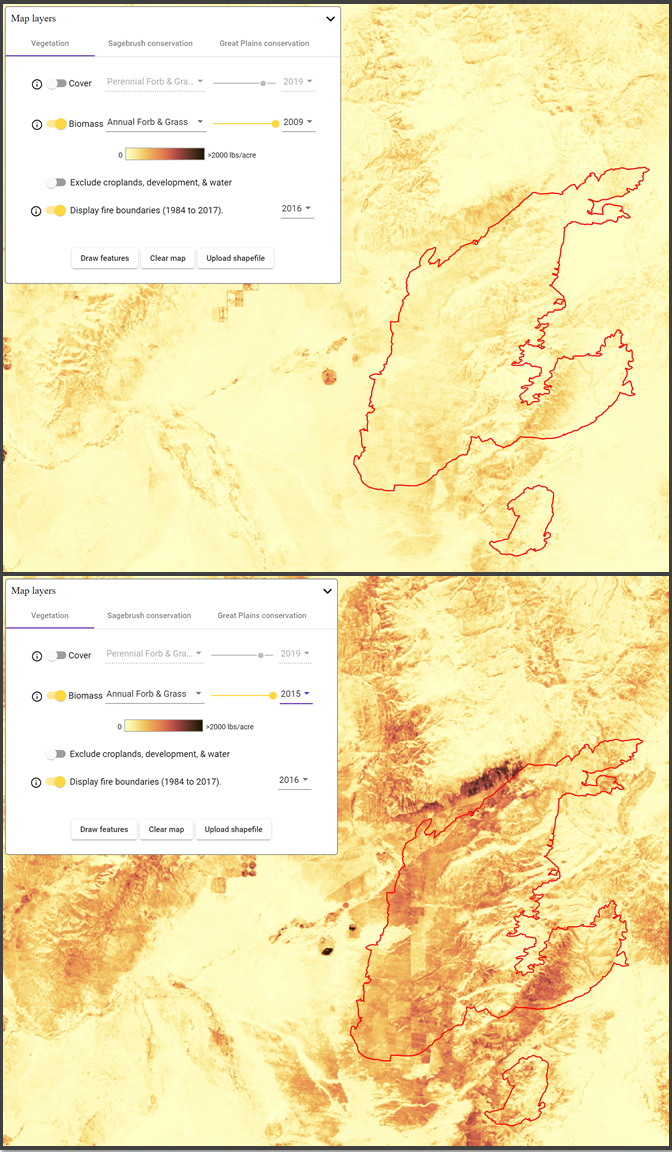
In the portion of the Great Basin in which the Hot Pot fire burned, annual grasses like cheatgrass drive wildfire cycles by making fires more frequent. Because RAP tracks Annual Forb and Grass biomass production, it can be useful for uncovering relationships between production and wildfire risk. In the two maps below, displayed on top is a roughly average Annual Forb and Grass biomass production year (2009) and on the bottom is Annual Forb and Grass biomass from 2015, the year preceding the Top Pot fire. In both maps, the "Display Fire Boundaries" switch is turned on for 2016 to show the outline of the Hot Pot fire. 2015 was a near-record year for Annual Forbs Grass production in this region and may have contributed to this large fire.

Aboveground biomass is the newest addition to the RAP and builds on the vegetation cover products discussed above. The models that produce the biomass maps incorporate data from satellite remote sensing, weather measurements, and the RAP vegetation cover data — importantly, these models account for variability in production between different vegetation communities. More information about these products can be found here.
Note:
Near-real-time 16-day biomass estimates are available within RAP as well through the Analysis Panel discussed below. 16-day biomass maps are not currently available in rangelands.app because of technical constraints.
