 Rangeland Analysis Platform
RAP Production Explorer

What is the Production Explorer?
Purpose
This application analyzes the Rangeland Analysis Platform's 16-day rangeland production data and is designed to assist with the assessment of current and historic departures from the long-term average and for assessing stocking rates.
Disclaimer
RAP should not be used in isolation. Such analyses should be conducted with information specific to the area under investigation. This application is preliminary and is subject to change.
Visit the application hereGetting started with the Production Explorer
- 1
-
Upload or draw your area of interest
- The Production Explorer will return estimated production for an area of interest you define. This can be in the form of polygons uploaded as a KML file or a ZIP file containing a shapefile. You can also choose to draw on the map directly.
- Shapefiles and KML files are two different ways of storing spatial information. A shapefile actually consists of four files that share a name but have different file extensions (SHP, DBF, PRJ, and SHX) while a KML file is a single file with the extension KML.
- For context or help drawing your area of interest accurately, you can change the type of map and toggle on an ownership layer showing the boundaries of private, state, federal, and tribal lands.
- If you upload polygons, you will need to click one or more to select them for analysis. If you select more than one polygon like multiple pastures within a grazing allotment, they will be analyzed as a single unit.
- 2
-
Set your analysis period
- Using the slider, define your start and end year for calculating the long-term average. The current production estimates will still be for the current year, even if the current year isn't included in this range.
- In most situations, the default period from 2001 through the most recent available year will be suitable. Use the slider to redefine the long-term period as needed for your work. For example, you may want to set the window to only the most recent five years if your area of interest has been in new and significant drought conditions since then.
-
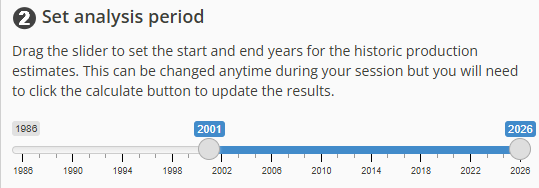
- Note: RAP data are only available for the years selectable on the selection slider. RAP estimates do not exist for periods prior to 1986.
- 3
-
Click the calculate button
- Once you have an area of interest drawn or selected and have confirmed your analysis period, click the "Calculate" button below the map. This will start the process of calculating estimated production and may take a few minutes to complete for very large areas or complicated polygons.
- 4
-
Use the "Current Production", "Historical Production", and "Stocking Rate" tabs to explore the data
- The current tab provides a near-real-time assessment of the current year's production relative to the long-term average. The historic Stocking Rate tab estimates stocking rates for the entire period selected by the user.
-
