Rangeland Production Dataset
The rangeland production dataset produces estimates of total new aboveground rangeland production, partitioned to annual production and perennial biomass. The data, at 30-meter spatial resolution from 1986–present, are available at annual and 16-day time steps. Note: it does not estimate standing biomass, but rather new accumulated growth over each 16-day period, which is then summed to an annual total.
The rangeland production data are produced using a process-based model, meaning the model does not use field-level biomass plots to estimate productivity. The model implemented here estimates plant productivity using three primary inputs:
- Continuous vegetation cover
- Absorbed solar radiation
- Meteorology
More specifically, this model calculates vegetation productivity based on how efficiently a plant uses absorbed solar radiation to add biomass considering local temperature and moisture conditions. This type of light-use efficiency model has been in use in ecology for nearly 50 years, but the iteration in RAP is an improvement over previous versions for a variety of reasons we’ll explore here.
Continuous vegetation cover
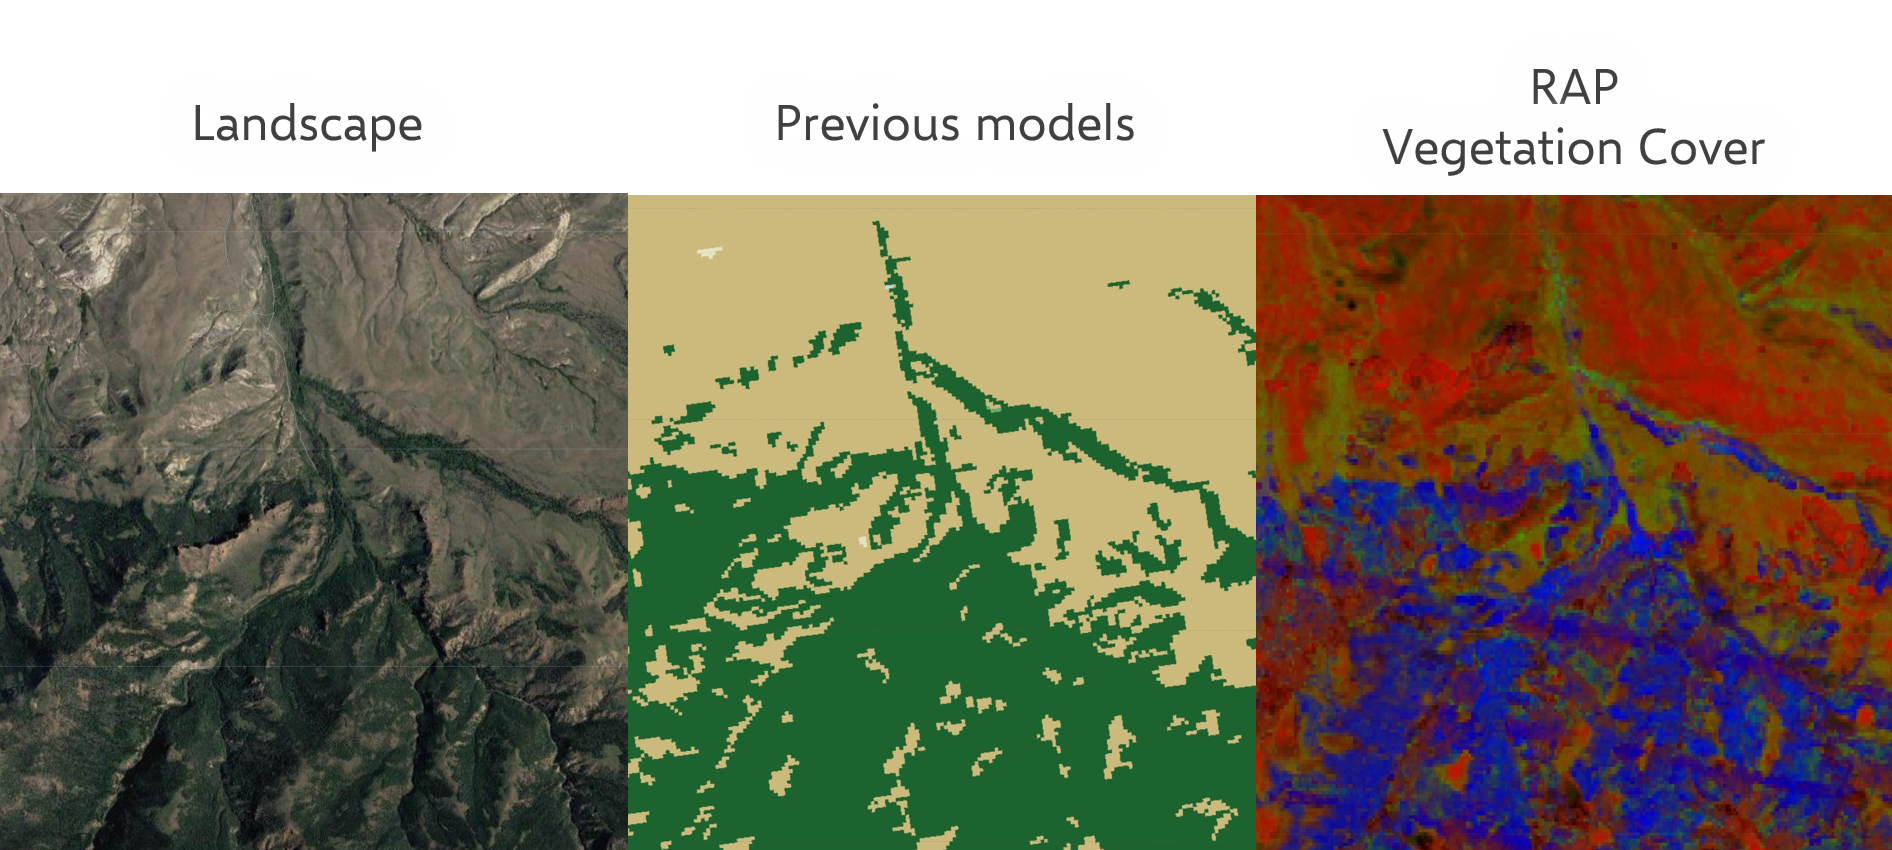
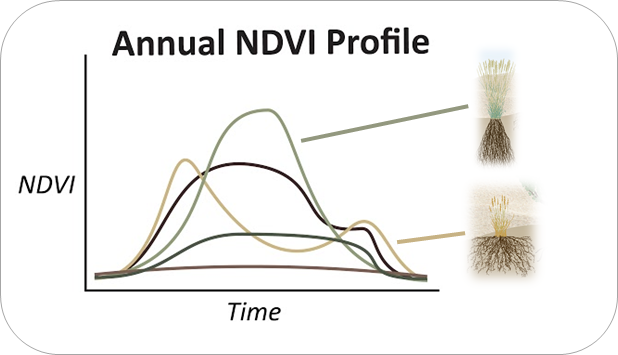
Plant productivity models historically used categorical vegetation cover data. In other words, each location (or pixel) was considered a single plant functional type (e.g. grass, shrub, tree) and productivity was calculated as though that was the only plant functional type (PFT) present. But in reality, most rangeland locations are a mixture of herbaceous vegetation, shrubs, and trees and the PFTs exhibit their own unique phenologies (i.e. timing of greenup and senescence). With RAP’s continuous vegetation cover dataset we can now calculate each PFT’s contribution to the overall productivity based on its cover percentage and its unique ecoregion-level phenology.

Absorbed solar radiation
Photosynthesis is the process that plants use to convert absorbed solar radiation to biomass. The amount of energy absorbed is related to the amount reflected, which we can measure using Landsat satellite data. Specifically, we use the normalized difference vegetation index (NDVI) to estimate the amount of radiation absorbed through the growing season (every 16 days), enabling us to estimate biomass production in near-real-time. Then, we use the RAP vegetation cover dataset to parse out how much of that NDVI signal is coming from each vegetation type.

Meteorology
Temperature and moisture availability both influence biomass production. The model incorporates temperature and vapor-pressure deficit (VPD). VPD is a common variable in drought monitoring and is essentially a measure of aridity.
Producing estimates of biomass production
In brief, the inputs described here are used to estimate net primary production which is converted to biomass using established equations.
We direct you to the scientific publications for technical details of this conversion and the general process described in this article.